
Customer Support KPIs: 7 Metrics Every Support Manager Must Track

What Are Customer Support KPIs and Why Do Most Teams Track the Wrong Ones? Customer support KPIs, or Key Performance Indicators, are the measurable metrics that evaluate how well a support operation is performing across three dimensions: customer satisfaction, operational efficiency, and cost. Most support teams track between 20 and 30 KPIs. Most teams also cannot name a single operational change they made last quarter based on that data. The problem is not a lack of measurement. It is measuring too many things and acting on none of them. High-performing support teams in 2026 track 8 to 12 core KPIs and review them weekly, not dozens reviewed once a quarter. This guide covers five things: the seven customer support KPIs that directly predict CSAT, churn, and cost, the 2026 benchmark for each metric, why deflection rate is a vanity metric that most teams should stop tracking, what a team tracking the wrong KPIs looks like versus one tracking the right ones, and a weekly KPI review process that takes under 30 minutes and produces actual operational changes. What Are the 7 Customer Support KPIs Every Manager Should Track Weekly? What Is CSAT and What Is a Good Benchmark in 2026? Customer Satisfaction (CSAT) measures short-term satisfaction with a specific support interaction; learn how to calculate CSAT scores accurately across channels. Review CSAT as part of your weekly customer support KPIs audit by ticket type and channel, rather than relying on monthly aggregate numbers. An overall CSAT of 78% can easily hide operational breakdowns in specific departments. What Is First Contact Resolution and What Is a Good FCR Benchmark? First Contact Resolution tracks the percentage of incoming customer issues resolved entirely within the initial contact, eliminating the need for follow-up. Among operational **customer support KPIs**, FCR is widely considered the single strongest indicator of customer satisfaction. What Is First Response Time and What Is a Good FRT Benchmark? First Response Time measures how long a customer waits from submitting a query until a human agent provides their initial reply. Ensure you evaluate FRT against channel-specific response time SLA targets when tracking customer support KPIs, rather than aggregating across all communication mediums. What Is Average Handle Time and What Is a Good AHT Benchmark? Average Handle Time (AHT) calculates the entire duration dedicated to resolving a single ticket, including talk time, chat duration, hold times, and post-conversation administration work. When analyzing customer support KPIs, a high handle time combined with high CSAT indicates an operational efficiency problem. High handle time combined with low CSAT indicates a resolution quality problem. What Is Customer Effort Score and Why Does It Predict Churn Better Than CSAT? Customer Effort Score (CES) evaluates how easy or difficult it was for a customer to get their issue resolved, scored on a 1-to-7 scale (ranging from “Very Easy” to “Very Difficult”). When tracking customer support KPIs, lower effort scores directly correlate with higher retention. CES is the strongest predictor of customer churn on individual support interactions slightly outperforming CSAT because customers vividly remember unnecessary friction even when the ultimate outcome was marked as satisfactory. What Is Cost Per Ticket and How Do You Calculate It? Cost Per Ticket quantifies total operational expenditures required to resolve a customer query. Tracking cost per ticket by channel highlights where automation investments yield the highest return on investment (ROI). What Is Resolution Rate and How Is It Different From Deflection Rate? Resolution Rate tracks the percentage of total incoming tickets successfully fixed, regardless of the number of touches required. Deflection rate merely counts contacts that never reached a human agent, assuming no response equals success. Resolution rate measures whether the customer’s problem was actually solved. A 70% deflection rate paired with a 45% resolution rate means over half of your “deflected” customers still have unresolved issues. What Is the Difference Between a Vanity KPI and an Actionable KPI? Most management frameworks list support metrics without distinguishing between operational signals and misleading vanity indicators. Tracking vanity customer support KPIs creates a false sense of efficiency while hiding systemic customer friction. Vanity KPI Actionable Replacement Why Deflection Rate Verified Resolution Rate + 72-Hour Recontact Rate Deflection counts customer frustration or giving up as a success metric. Total Ticket Volume Ticket Volume by Type & Channel Aggregate volume obscures structural product or service breakdowns. Average CSAT CSAT score by Ticket Type & Agent Averages mask extreme splits, such as 48% on return disputes vs. 91% on billing. First Response Time Average FRT by Channel against Channel-Specific SLA Email and WhatsApp operate on completely different expectations. Agent Utilisation Rate FCR Rate by Agent High utilization paired with low FCR indicates busy, inefficient interactions. What Does a Team Tracking the Wrong KPIs Look Like vs the Right Ones? Consider two teams of equal scale: 10 support agents handling 500 daily tickets. Operating Metric / Behavior Team A: Tracking Wrong KPIs Team B: Tracking Right KPIs Dashboard Focus 28 metrics reviewed monthly 7 core metrics reviewed weekly CSAT Visibility One aggregate monthly number Segmented by ticket type, channel, & agent weekly FCR Tracking Not tracked separately from response rate Tracked by ticket type with a 7-day recontact window Deflection Measurement Tracked as an absolute success metric Replaced with verified resolution rate Operational Changes 0 to 1 per quarter (based on gut feel) 4 to 6 per quarter (driven by metric trends) Overall CSAT Score 64% 81% Monthly Repeat Contacts 4,800 2,100 The Cost Impact Reducing monthly repeat contacts from 4,800 to 2,100 eliminates 2,700 unnecessary agent-handled interactions. At an industry benchmark of $13.50 per ticket (Gartner), this operational shift generates: These savings are realized entirely by tracking FCR at the ticket-type level and systematically fixing the root causes driving repeat contacts. How Do You Run a Weekly KPI Review in Under 30 Minutes? Frequently Asked Questions What are customer support KPIs? Customer support KPIs (Key Performance Indicators) are specific quantitative measures used to track the efficiency, quality, and financial performance of customer service teams. They evaluate critical areas
First Contact Resolution: Formula, Benchmarks and How to Improve FCR in 2026
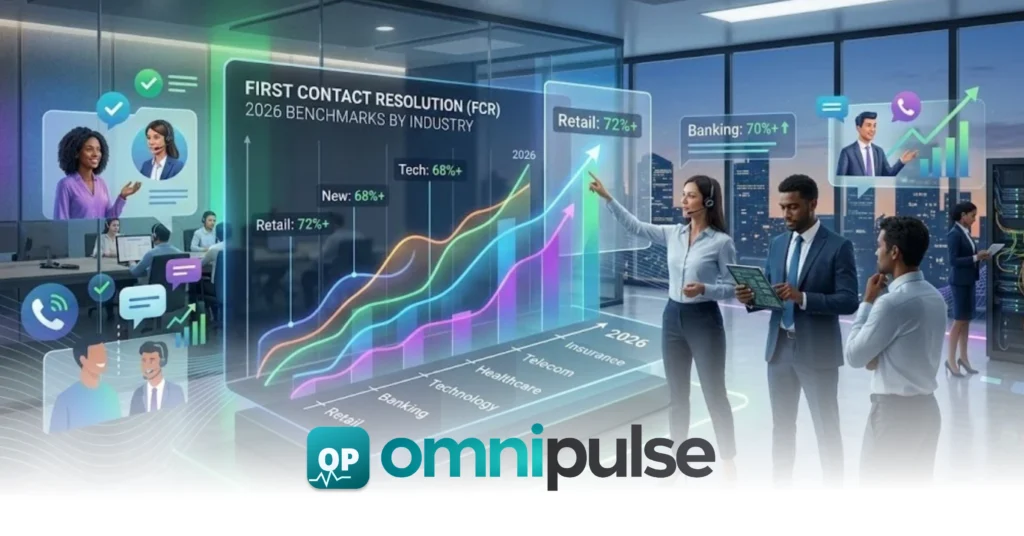
First contact resolution, or FCR, is the percentage of customer support issues that are fully resolved during the first interaction, without the customer needing to follow up a second time about the same problem. It is calculated using a simple formula: the number of issues resolved on first contact divided by the total number of issues handled, multiplied by 100. A team that resolves 800 out of 1,000 tickets without a follow-up has an FCR rate of 80%. The cross-industry average in 2026 sits at 70%, meaning three in ten customers leave their first support interaction without a resolution and have to contact the business again. This guide covers six things: how to calculate first contact resolution correctly, what the 2026 FCR benchmarks are by industry, why FCR is the single most important metric for predicting CSAT and retention, the five operational levers that move FCR, what a low-FCR team looks like versus a high-FCR one, and a step-by-step diagnosis process for finding exactly where your FCR is leaking. What Is First Contact Resolution and How Do You Calculate It? First contact resolution measures the percentage of support issues that are successfully resolved during the initial point of contact. To calculate FCR accurately, divide the total number of issues resolved on first contact by the total number of unique issues handled within a given period, then multiply by 100. For example, if a support team handles 1,000 tickets in a week and 750 of those tickets are fully resolved without requiring a second contact or follow-up from the customer, the FCR calculation is: FCR (%) = 750/1,000 * 100 = 75% The most common calculation mistake occurs when support teams confuse first response time with first contact resolution. Sending an automated or agent reply within 60 seconds counts toward a first response time SLA, but it only contributes to FCR if the customer’s issue is entirely resolved in that interaction and no further outreach is needed. Teams that mistake first response for first resolution consistently overstate their actual FCR rate by 15 to 25 percentage points. To maintain calculation accuracy, organizations use the 7-day window rule. The 7-day window is the standard measurement period established by SQM Group. If a customer initiates contact regarding the same issue within 7 days of the initial ticket closing, the original interaction is reclassified as an FCR failure regardless of how the agent tagged it upon ticket resolution. Key Benchmark Callout: The cross-industry average first contact resolution rate is 70% in 2026. World-class FCR starts at 80%. Only 5% of contact centers currently clear this threshold. What Is a Good First Contact Resolution Rate by Industry in 2026? FCR benchmarks vary significantly by industry because ticket complexity, regulatory constraints, and agent authority levels differ. Comparing your FCR against a cross-industry average provides limited operational insight, whereas sector-specific comparisons offer clear performance targets. What Is a Good FCR Rate for Retail and E-Commerce? Retail achieves the highest average FCR of any industry at 78%, according to Fullview benchmarking data cited in Ringly.io’s 2026 FCR analysis. General e-commerce benchmarks fall between 75% and 85%. Retail leads cross-industry metrics primarily due to ticket structure: order tracking, simple product inquiries, and return processing are clear, bounded tasks that agents can resolve within a single interaction using standard authority levels. What Is a Good FCR Rate for Technology and SaaS? IT help desks and SaaS support teams handle higher technical complexity than retail contact centers. Tickets resolved with integrated AI automation achieve a median resolution time of 4.4 hours versus 71 hours for fully manual tickets, according to industry research tracking IT help desk benchmarks. Target FCR benchmarks for B2B SaaS organizations range from 72% to 82% depending on system architecture and integration depth. What Is a Good FCR Rate for Telecom? Telecom consistently records the lowest FCR of any major industry, typically ranging between 60% and 68%. The primary driver is not agent performance but systemic issue structure. Complex billing disputes, network coverage adjustments, and hardware provisioning require asynchronous back-end system changes that cannot be completed in real time. SQM Group benchmarking attributes roughly 40% of telecom repeat contacts to back-office processing rules or system limitations rather than agent errors. What Is a Good FCR Rate for Healthcare and Financial Services? Healthcare and financial services organizations record average FCR benchmarks between 65% and 75%. These lower figures stem directly from strict compliance mandates, multi-factor identity verification protocols, and regulatory sign-offs required before agents can complete account actions. Any team operating within healthcare or financial services that sustains an FCR above 75% is delivering top-quartile performance. What Is World-Class FCR? World-class FCR begins at 80% across all sectors, according to SQM Group. Historically, fewer than 5% of contact centers achieved this mark. However, the deployment of hybrid support models combining generative AI for tier-1 issues with specialized human agents for complex escalations is enabling mid-market organizations to reach 80% FCR consistently. Why Is First Contact Resolution the Most Important Support Metric? Every 1% improvement in first contact resolution produces a direct 1% improvement in overall CSAT score, according to research by SQM Group. Conversely, every repeat contact a customer is forced to make regarding an unresolved issue drops their customer satisfaction score by 15%. This linear relationship exists because customers evaluate support quality based on effort expended. No other operational metric, including response time or average handle time, demonstrates a 1-to-1 impact on CSAT. FCR serves as the strongest operational predictor of customer retention and churn. According to Gartner research, 96% of customers who experience high-effort interactions, such as reaching out multiple times to solve a single issue, report feeling disloyal to the brand afterward. Resolving customer inquiries on the first attempt removes the friction that drives customers to evaluate alternative competitors. Key Impact Callout: Every 1% improvement in first contact resolution produces a 1% improvement in CSAT. Every repeat contact drops customer satisfaction by 15%. The cost impact of unresolved tickets is compounding and measurable. Gartner benchmarks
Customer Experience Platform: 5 Massive Ways Tool Consolidation Saves Thousands

Imagine walking into a modern office and watching a customer support agent work. They open a tab for email. They open a second tab for WhatsApp. A third flashes for SMS, a fourth rings for a voice call, and a fifth tracks internal notes. This is the “Tab Habit,” and it is quietly killing your bottom line. Research shows that context switching the act of jumping between disconnected apps can drain up to 40% of an employee’s daily productivity. When your team spends more time managing software than helping humans, you aren’t just losing time. You are paying a hidden, compounding fee on your operational budget. We call this the Silo Tax. To break free from this cycle, growth-minded companies are moving away from fragmented software ecosystems. They are turning to a unified Customer Experience Platform to streamline workflows, protect their profit margins, and rescue their teams from terminal burnout. Omnipulse was built by people who grew completely exhausted by bad, siloed tools. We designed it as a single, centralized command center that replaces chaos with clarity, paying for itself through sheer operational efficiency. What is a customer experience platform and why does it matter? A modern customer experience platform is far more than an aggregation of communication channels. Think of it as an operational command center for your entire customer-facing business. Historically, companies adopted a reactionary approach to software. They bought one tool for email, added another for the WhatsApp Business API, tacked on an SMS provider, and integrated a legacy voice solution. The result? A fragmented tech stack where data lives in isolated pockets. [Legacy Setup]: SMS Tab + WhatsApp Tab + Email Tab + Voice Tab = Divided Context VS. [Omnipulse Setup]: Unified Timeline -> Single Command Center -> Complete Context A true customer experience platform fundamentally shifts this dynamic. It converges every single touchpoint into a single, unified timeline. Whether a customer reaches out via text on the streets of Nairobi, sends a WhatsApp message in Sharjah, or places a voice call from London, the conversation flows into one stream. This consolidation matters because customers no longer view their interactions with you through the lens of individual departments. They expect a seamless, continuous conversation. When your software reflects that expectation, your business gains an immediate competitive advantage. How does a customer experience platform reduce operational overhead? The most immediate impact of deploying an enterprise-grade customer experience platform is the elimination of software redundancy. Let’s run an audit on the typical “Silo Tax” paid by a scaling business managing a fractured stack. The Silo Tax Audit When you rely on separate tools, your monthly software invoice looks something like this: That totals $200 per agent, every single month, spread across five different vendors, five separate contracts, and five points of failure. By migrating to a consolidated customer experience platform, you compress those five subscriptions into a single unified workspace, often slashing your direct software licensing costs by half. Eliminating the “Falling Through the Cracks” Tax Beyond the software bills, fragmented tools introduce massive operational risk. When channels are siloed, messages inevitably get missed. An agent might resolve an email ticket without realizing the same customer left an urgent, angry message on WhatsApp ten minutes prior. A Unified Inbox eliminates this blindness. Because every channel feeds into a centralized interface, tickets cannot vanish into the ether. Fragmented Tools: [Email] [WhatsApp] [SMS] -> High Risk of Missed Messages Unified Inbox: [Incoming Channels] —> [Single Stream] -> Zero Missed Messages This structural clarity yields massive dividends. Consider Aeroworld, an industry leader that faced crippled response times due to tool fragmentation. After consolidating their entire communication stack into Omnipulse, they achieved a staggering 60% drop in team response times within the very first month. They didn’t hire more staff; they simply removed the friction caused by their software. Why is tool consolidation important for business growth? To scale a business effectively, you must decouple revenue growth from headcount growth. If your operations require you to hire a new support agent for every X number of new customers, your business model isn’t truly scaling—it’s just expanding its overhead. Traditional Growth: More Customers = More Staff = Linear Overhead Cost Consolidated Growth: More Customers + Omnipulse = Static Staff = Exponential Profit Tool consolidation allows your existing team to handle a significantly higher volume of interactions without compromising quality. By removing the friction of app-switching, you unlock hidden capacity within your workforce. A clear example of this can be seen at the Erum Saba Medical Center. Managing multi-channel patient communications across various platforms was draining hours of administrative time every single day. By moving their entire operation over to a unified customer experience platform, they successfully saved 40 hours weekly. That is the equivalent of adding a full-time employee to their staff, completely free of charge, simply by optimizing their digital workspace. Furthermore, a consolidated architecture ensures global operational resilience. Omnipulse was built from the ground up to handle complex, regional communication networks. A platform engineered to handle infrastructure demands across Sharjah and Nairobi is more than resilient enough to power enterprises in London and across the globe. True consolidation gives you the infrastructure to grow anywhere, anytime. Can a customer experience platform improve agent productivity? When agents are forced to use poorly optimized tools, performance drops and burnout skyrockets. A customer experience platform fundamentally alters the day-to-day agent experience by automating administrative busywork. Through Smart Assignment engines and customizable Automation Flows, incoming messages are instantly routed to the best-equipped agent based on language, channel, or past interaction history. Agents no longer waste time manually cherry-picking tickets or passing customers back and forth across departments. Feature Fragmented Stack Problems Omnipulse Solution Routing Manual triage, delayed handoffs, lost tickets Smart Assignment engine routes instantly Context Blind agents, repeating questions, frustrated users Full Conversation History on one screen Workflow Constant app-switching, high cognitive load Continuous Unified Inbox workspace The greatest benefit of an integrated customer experience platform, however, is the preservation of
Customer Experience Software: 6 Critical Lessons from Sharjah and Nairobi Growth

For years, the playbook for building enterprise customer experience software was written in Silicon Valley. Silicon Valley assumed everyone had fiber-optic internet, unlimited 5G data plans, the latest iOS devices, and a cultural expectation of support that revolved around a standard 9-to-5, Monday-to-Friday ticket queue. But the global landscape of 2026 looks vastly different. Today, the fastest-growing enterprises are scaling in markets where connectivity can be intermittent, mobile-first messaging is the absolute default, and customer expectations are incredibly high. To thrive globally, companies need customer experience software that is built not just for the ideal conditions of San Francisco or London, but for the real-world complexities of Sharjah, Nairobi, and beyond. At Omnipulse, our foundational philosophy is simple: Built for Everyone. We believe that if customer experience software can survive and thrive under the high-stakes, hyper-scale demands of emerging markets, it will easily outperform legacy tools when deployed in traditional enterprise environments. Consider this: How does a lightweight digital communication platform engineered for a bustling medical center in East Africa end up becoming the ultimate mission-critical command center for a global, multi-million-dollar private aviation firm? The answer lies in a paradigm shift. True resilience isn’t built in a laboratory; it’s forged in the field. Below, we break down the 7 critical lessons from global growth that explain why the next generation of customer experience software is being defined by its adaptability to the real world. What is the most important feature of customer experience software? When operational leaders look to upgrade their customer experience software, they are often bombarded with feature checklists. They see promises of hyper-advanced sentiment analysis, complex workflow builders, and niche integrations. But if you ask a VP of Operations trying to coordinate hundreds of international agents, the answer is far simpler and more practical: visibility and consolidation. The absolute most critical feature of modern customer experience software is a Unified Inbox that acts as a central Command Center. In a traditional customer support environment, agents are forced to juggle multiple browser tabs. They have one window open for emails, another for SMS, a third-party app for the WhatsApp Business API, and a legacy softphone client running in the background. This fragmentation leads to: A Unified Inbox cures this “tab fatigue” by bringing every inbound and outbound communication SMS, WhatsApp, email, and voice calls into a single, continuous, chronological timeline. When an agent opens a ticket, they don’t just see the latest message; they see the entire historical relationship with that customer, regardless of which channel was used. By transforming your customer experience software into a Command Center, your team spends less time searching for context and more time resolving issues. How does customer experience software improve global communication? Expanding into international markets is no longer a luxury reserved for Fortune 500 companies; in 2026, it is a default growth strategy. However, expanding your footprint means navigating a complex web of local telecommunication standards, regional messaging preferences, and language barriers. To facilitate true global communication, customer experience software must possess a highly optimized infrastructure. Omnipulse achieves this through a robust global network spanning over 140 countries. This ensures that whether your customer is in Tokyo, Nairobi, or Frankfurt, messages are delivered instantly, without latency or packet loss. A major pillar of this global capability is the integration of advanced AI Voice technology. When managing customers across multiple time zones, hiring localized, round-the-clock support teams is often cost-prohibitive. With AI Voice, businesses can deploy intelligent agents capable of handling complex, spoken-word queries in dozens of localized languages and accents. This is not the robotic “press 1 for billing” IVR system of the past. It is an empathetic, context-aware conversational engine that answers calls on the first ring, resolves common inquiries instantly, and notes key details in the CRM. By deploying localized virtual agents who can speak the native language of your target market fluently, you ensure that every customer feels like your only customer, no matter where they are in the world. Why should businesses look beyond traditional support tools? The legacy customer support platforms that dominated the 2010s were designed for a static, desktop-centric world. They were built on heavy, rigid codebases that required months of custom development, expensive external consultants, and extensive training programs just to get up and running. In a fast-paced market, these traditional systems represent a massive bottleneck. The True Cost of Tab Fatigue and Siloed Data When your agents are forced to constantly switch tabs to find customer information, it creates a cognitive load that leads to burnout and errors. If an agent has to log into a legacy phone portal to listen to a voicemail, check a CRM for a customer’s purchase history, and then draft an email in a separate client, the average resolution time skyrockets. More importantly, valuable data slips through the cracks. If a customer mentions a critical shipping preference on WhatsApp, that information rarely makes it into the master customer profile, forcing the customer to repeat themselves during their next interaction. The 5-Day Deployment Advantage In contrast, modern customer experience software prioritizes speed-to-value. At Omnipulse, we pride ourselves on a 5-day average setup time. Instead of embarking on a multi-month onboarding project, our platform allows you to connect your existing communication channels, integrate your database, and train your agents in less than a week. Operational Impact: A fast setup means your business stays agile. If you decide to launch a new service line in a new country, you can configure and deploy a dedicated customer communication hub in days, not quarters. Can customer experience software reduce support costs in emerging markets? One of the most powerful case studies for this lightweight, high-efficiency approach comes from Erum Saba Medical Center, a rapidly growing healthcare provider operating in a highly demanding environment. ERUM SABA MEDICAL CENTER: SCALE WITHOUT HEADCOUNT [ 50,000+ Patients Managed ] ──► [ 0 New Support Staff Hired ] HOW IT WAS DONE: 1. WhatsApp Business API used for all appointments 2. AI-driven Automation Flows
What Is CSAT Score? How to Calculate, Benchmark, and Improve It in 2026

CSAT score, or Customer Satisfaction Score, is a metric that measures how satisfied a customer was with a specific interaction, such as a support ticket, an onboarding session, or a billing query. It is calculated by asking the customer one question: “How satisfied were you with this experience?” on a 1 to 5 scale. Only responses of 4 and 5 count as satisfied. CSAT is expressed as a percentage using the formula: number of satisfied responses divided by total responses, multiplied by 100. A response of 3 out of 5 is not a neutral result. It is an unsatisfied result and counts against your score. This distinction is the most commonly misunderstood aspect of CSAT calculation. This guide covers eight things: the CSAT formula and how to calculate CSAT score correctly, what is a good CSAT score by industry in 2026, how CSAT compares to NPS, how CSAT compares to CES, the five specific operational levers that move CSAT scores, what a low-CSAT operation looks like versus a high-CSAT one, the five mistakes businesses make that hold their CSAT scores down despite genuine effort, and how to diagnose which lever is responsible for your current score. Key Takeaways Stat callout: The cross-industry average CSAT score is 78 out of 100 in 2026. Financial services leads at 83. Communication and media scores lowest at 26. How Do You Calculate CSAT Score Correctly? (The CSAT Formula) The CSAT formula is simple: the number of satisfied responses divided by total responses, multiplied by 100. Satisfied responses are ratings of 4 or 5 on a 1 to 5 scale. A rating of 3 is not neutral. It is dissatisfied and does not count toward your score. Here is a worked example using the CSAT formula. 100 customers receive a post-interaction survey. 62 respond. Of those 62 responses, 48 give a rating of 4 or 5. CSAT equals 48 divided by 62, multiplied by 100, which equals 77.4%. The most common mistake when applying the CSAT formula is including all responses of 3, 4, and 5 as positive. This inflates CSAT by 15 to 25 points and produces a number that has no relation to how customers actually feel. The industry standard method, called Top 2 Box, counts only 4s and 5s. If your CSAT formula is applied any other way, your benchmark comparisons are meaningless. What Is a Good CSAT Score by Industry in 2026? CSAT scores vary dramatically by industry. Comparing your score against a cross-industry average tells you almost nothing useful. Compare it against your sector benchmark. Here are the 2026 benchmarks organised by industry cluster, answering exactly what is a good CSAT score for each sector. What Is a Good CSAT Score for SaaS and Technology Companies? Software and SaaS sits at 78 to 80 on the 2026 benchmark, making it one of the most competitive sectors for customer satisfaction. Products with strong customer support typically score 5 to 10 percentage points above those with slower or limited support. SaaS companies that want to lead the market should aim for CSAT scores of 85 or higher. What Is a Good CSAT Score for E-Commerce and Retail? E-commerce and retail CSAT benchmark sits at 80 to 82. This range reflects strong performance but remains under consistent pressure from rising delivery expectations and increasing return volumes. Brands with real-time order communication and fast first response times consistently score above 82 in this sector. What Is a Good CSAT Score for Financial Services? Financial services leads all sectors in 2026 at 83. The sector’s high CSAT despite dealing with sensitive and often stressful customer issues reflects strong investment in agent empowerment and first contact resolution. Banking AI adoption grew 24.3% in two years, with AI handling security, speed, and personalised guidance contributing to the sector’s top-tier score. What Is a Good CSAT Score for Healthcare? Healthcare CSAT sits at 57 in 2026, a significant drop from 81 in 2025. This drop reflects the sector’s structural challenge: high patient expectations meeting under-resourced communication infrastructure. Healthcare organisations managing patient queries across WhatsApp and email with unified inboxes report materially higher satisfaction than those using fragmented tools. What Is the Lowest-Performing Sector for CSAT in 2026? Communication and media scores 26 in 2026, the lowest of any sector tracked. Construction follows closely behind. Both sectors share a structural problem: customers interact with them during high-stress moments, such as service outages and project disputes, and encounter slow, fragmented communication tools that compound frustration. Looking to fix the channel fragmentation behind a low CSAT score? Omnipulse unifies WhatsApp, Email, and SMS into one shared inbox so agents never lose context between channels. Request a Demo CSAT vs NPS: What Is the Difference? CSAT measures satisfaction with a specific interaction. It is transactional and short-term, best used after a support ticket closes, an onboarding session ends, or a billing query resolves. It answers the question: how did we do on this specific interaction? NPS, or Net Promoter Score, measures overall loyalty and the likelihood a customer would recommend your brand. It is relational and long-term, best used in quarterly relationship surveys. It answers the question: how does this customer feel about us overall? The key distinction in the CSAT vs NPS comparison is timeframe and scope. CSAT is a snapshot of one moment. NPS is a verdict on the entire relationship. NPS and CSAT are only weakly correlated at r=0.52, meaning a high NPS does not reliably predict high CSAT on individual support interactions, and a strong CSAT score on a single ticket does not guarantee the customer would recommend you overall. A business can score well on CSAT after every support ticket while still carrying a mediocre NPS, if the product itself has unrelated weaknesses. Use CSAT after every support interaction to track interaction quality. Use NPS quarterly to track relationship health. The two metrics answer different questions and neither replaces the other. CSAT vs CES: Which One Should You Track? CES, or Customer Effort Score, measures how